Results
What hermod measured
Every number on this page comes from a file hermod's own commands wrote, linked below each table, all run on one laptop (an i5-1335U with 12 threads). The drivers are a model, the demand is from 2010, and road speeds are static by the hour: these are claims about a simulated Manhattan, stated with their limits.
Matching: greedy against batched
The share of riders served, their waits and pickup times, and how hard the fleet worked, for 2,000 to 10,000 drivers online on a replayed 2010 morning (07:00 to 10:00, measured from 07:30), each point the median of 10 seeds with the band from lowest to highest. Short of drivers, a 10 s batch served far more riders than greedy. Half the 2010 pickup times are rounded to the minute, which flatters short batch windows: with them spread out, the 10 s window's gain held at every fleet size, but most of the 1 s and 2 s windows' gain above 2,000 drivers was the bursts.
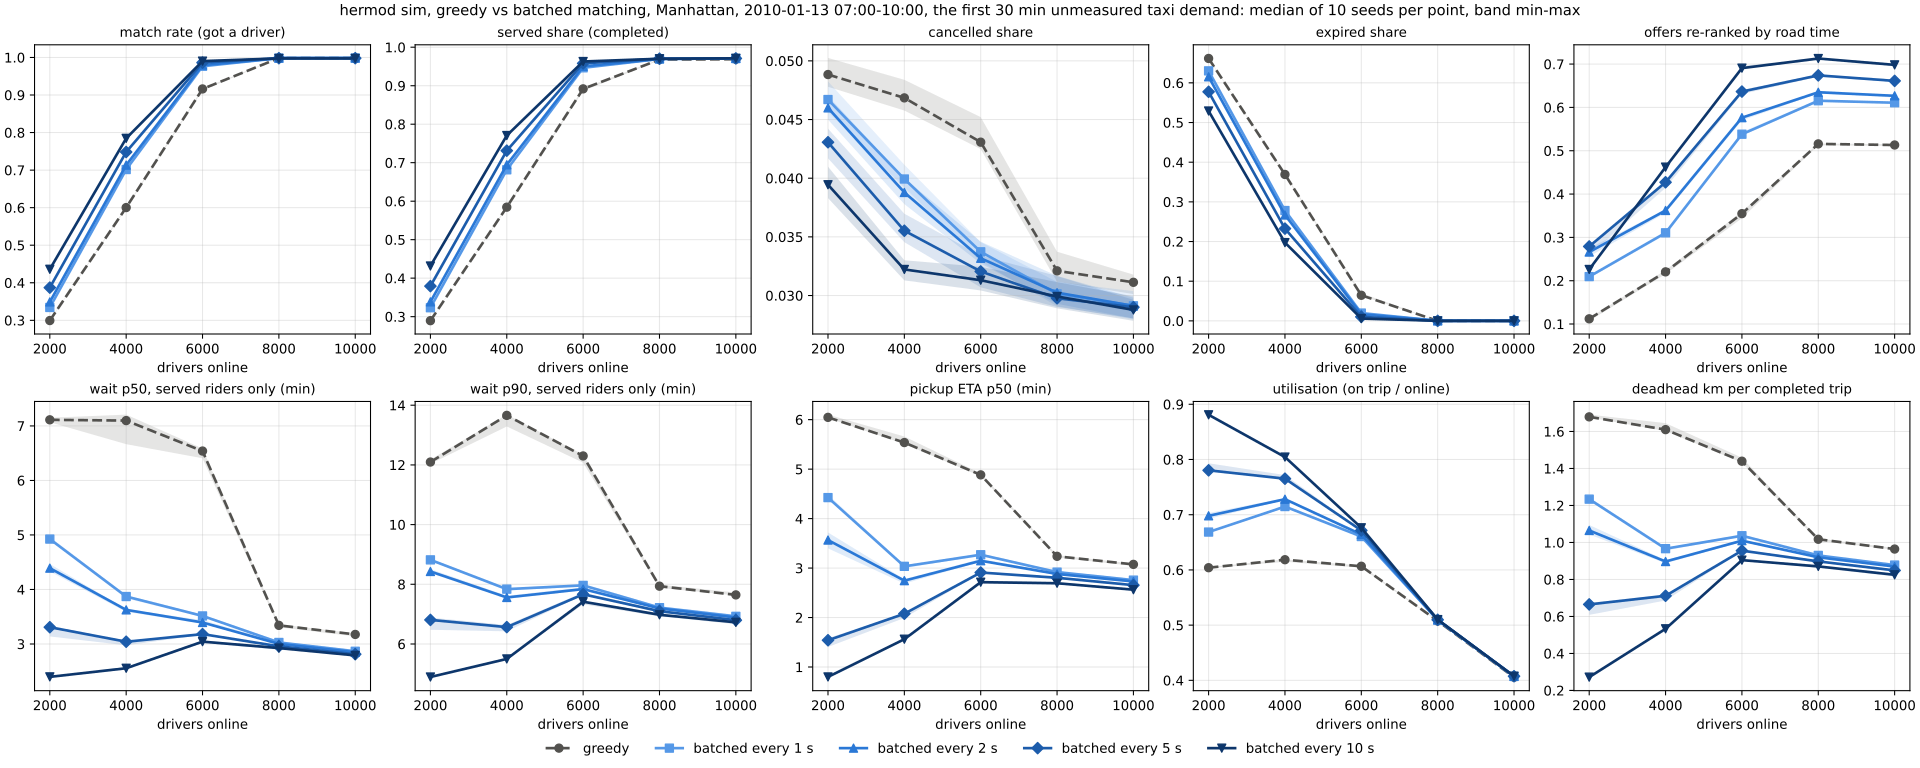
- curves.svg: make curves, greedy rows from 2026-11-04-2c02609 (PLAN 13). From bench/results/2026-11-05-fb33bf1/curves.svg.
- curves.csv: make curves: medians and min-max of 10 seeds per point. From bench/results/2026-11-05-fb33bf1/curves.csv.
The live engine under load
hermod serve with 10,000 drivers online, under k6 at constant arrival rates for 3 minutes a run, on the same laptop as the server. The busiest hour is 10 ride requests a second with every driver reporting its position every 4 s; ten times is 100 and 10,000. Every run's event log went through the invariant checker. Ten times is more than 10,000 drivers can carry, so its expired requests are the fleet running out, not the engine. The last row is the laptop's ceiling over HTTP: k6, sharing the CPU with the server, couldn't keep up 20,000 a second.
| Run | Sent/s | Location p50 / p99 ms | Ride request p50 / p99 ms | Completed | Cancelled | Expired | Violations |
|---|---|---|---|---|---|---|---|
| Busiest hour, batched every 10 s | 2,560 | 0.178 / 0.4 | 0.993 / 4.23 | 1,742 | 58 | 0 | 0 |
| Busiest hour, greedy | 2,558 | 0.159 / 0.35 | 0.64 / 3.61 | 1,763 | 38 | 0 | 0 |
| Ten times, batched | 10,143 | 0.147 / 1.85 | 0.636 / 4.07 | 14,799 | 387 | 2,815 | 0 |
| Ten times, greedy | 10,135 | 0.149 / 3.4 | 0.652 / 4.98 | 15,388 | 314 | 2,299 | 0 |
| 20,000 updates/s, batched | 19,701 | 0.402 / 74.4 | 3.64 / 95.1 | 1,754 | 47 | 0 | 0 |
- load.csv: make load: one row per k6 run against hermod serve (PLAN 13). From bench/results/2026-11-11-f299da9/load.csv.
Nearest driver: the grid against Valkey
Finding the 20 nearest of 5,000 drivers, and recording a driver's position, in hermod's in-process grid and in Valkey's GEO commands over loopback, the median of 10 runs each. Valkey's own time, from its command statistics, leaves the network out.
| Grid µs | Valkey, round trip µs | Valkey, its own time µs | |
|---|---|---|---|
| nearest 20 of 5,000 | 1.69 | 105.564 | 26.856 |
| one update, sent alone | 0.079 | 69.748 | 2.268 |
| one update, 100 to a pipeline | – | 3.099 | 0.905 |
- nearest.csv: make bench: the grid against Valkey GEO, medians of 10 runs (PLAN 8.2). From bench/results/2026-11-04-5ba6ad6/bench.txt.
Routing
On one core, across 1,024 random pairs of Manhattan junctions: one pair by Dijkstra and by A*, and the search matching uses, which times 20 nearby drivers to one pickup within 10 minutes. Against OSRM on the same map, over 1,000 pairs, the median route length differs by +0.04% and the median travel time by +6.93%, from the two speed tables.
| Query | ms | Junctions settled |
|---|---|---|
| Dijkstra, one pair | 1.854 | 18,469 |
| A*, one pair | 1.117 | 10,188 |
| one-to-many: 20 drivers within 10 min | 0.793 | 10,746 |
- routing.csv: make bench: one core, 1,024 random pairs, medians of 10 runs (PLAN 8.1). From bench/results/2026-11-04-f8d851b/bench.txt.
- osrm_summary.csv: make osrm-compare: 1,000 pairs against OSRM on the same map (PLAN 8.1). From bench/results/2026-11-03-5799b4a/osrm_summary.csv.